
Just What do they See?
Back in 2013, I was hired by Tapor.ca (under the University of Alberta) to help write reviews for the website. I wrote a couple of them, but what I really wanted to do was make visualizations. The research group I was a part of had access to a couple of datasets: the complete text of the journal Computers and the Humanities (CHum), and a large collection of tweets that I had helped scrape. We had a good brainstorming session about what we could do with this data, which generated a lot of good ideas. Eventually, we built some of those ideas and “Just What do they See?” was born.
The name of the website is a play on the name of the research grant that we were working under: “Just what do they use?”. The grant was mainly focused on cataloging research tools that were actually being used by researchers, and as such one of my main focuses was creating visualizations that were actually useful in dissecting the data. I don’t think I succeeded with all of them, but I do credit this project with kickstarting my love of tools. To this day, I still find it important to focus on usability by the actual people the tool was focused on.
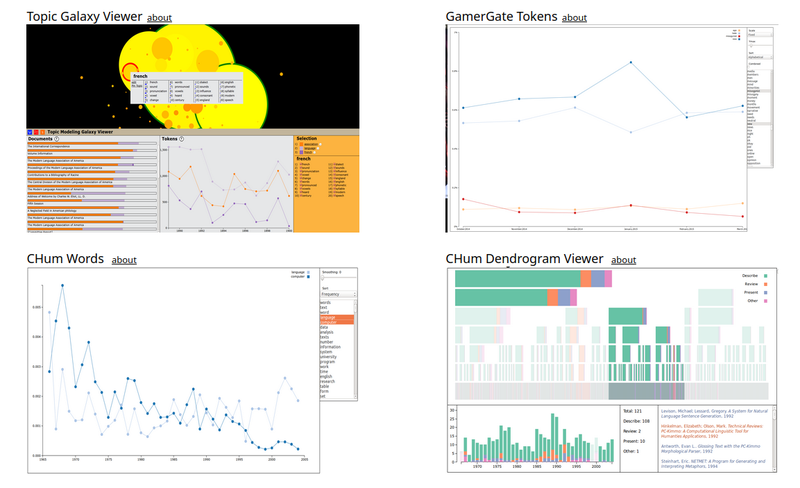
The website didn’t start as a single planned object. Instead, I worked with several designers and dataset maintainers on different datasets, and independently we created several different experimental visualizations. Many of which were the basis for numerous papers and presentations over the years. A complete list of papers (that I know about) can be found here. Later, I worked with Geoffrey Rockwell to find hosting for the visualizations. I would also like to thank Jennifer Windsor specifically who came up with the title and created the banner.
All in all, I am quite proud of this project. It was my first web-based javascript project, and working with D3 really stretched my understanding of computer languages, a skill I still use to this day. It also cemented my love for minimalist web page design.
Note: There is a secret hidden visualization located here. This was to extend a force directed graph into a third dimension to allow more space to “untangle the hairball”. It didn’t work, and the idea never went anywhere, but I thought it was cool enough that I left it in.